Renders below are from current builds. Specs and release dates move as the products do.
In development
3D Storm Visualization
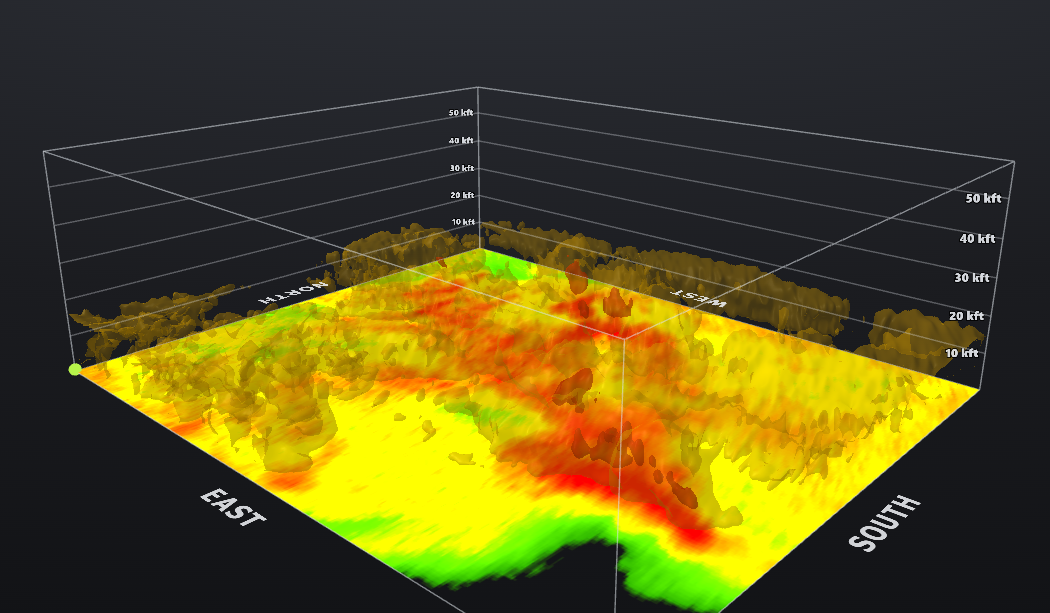
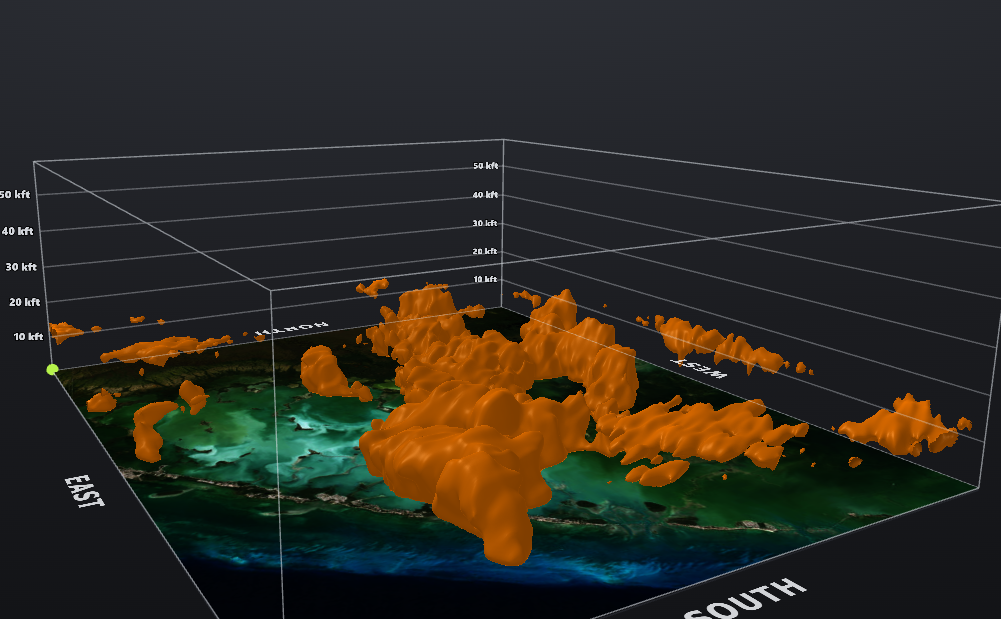
3D STORM VISUALIZATION38.96°N 98.00°W, 10 KFT TO 50 KFT, LEVEL-II VOLUME
Volumetric storm rendering with height-tagged structure. Red cores, gold anvils, reflectivity on a real dBZ scale. Built for severe weather breakdowns and case studies.
Height axis from 10 to 50 kft
Still frames and turntable loops
Any storm, any time window
Dev update: 3D loading got much faster
Same KUEX storm volume, same laptop, 384 × 96 × 384 brick. Red bars are the old code. REF bricks are bit-for-bit identical, and the page now makes one request instead of three.
Case
Before
After
Speedup
REF, box on radar
76.8s
3.7s
21×
REF, typical storm box
16.2s
2.3s
7×
REF, empty box
314.8s
4.5s
70×
VEL, box on radar
80.6s
14.1s
5.7×
VEL, typical storm box
20.4s
2.1s
10×
In development · Customizable for broadcast
3D Weather Graphs
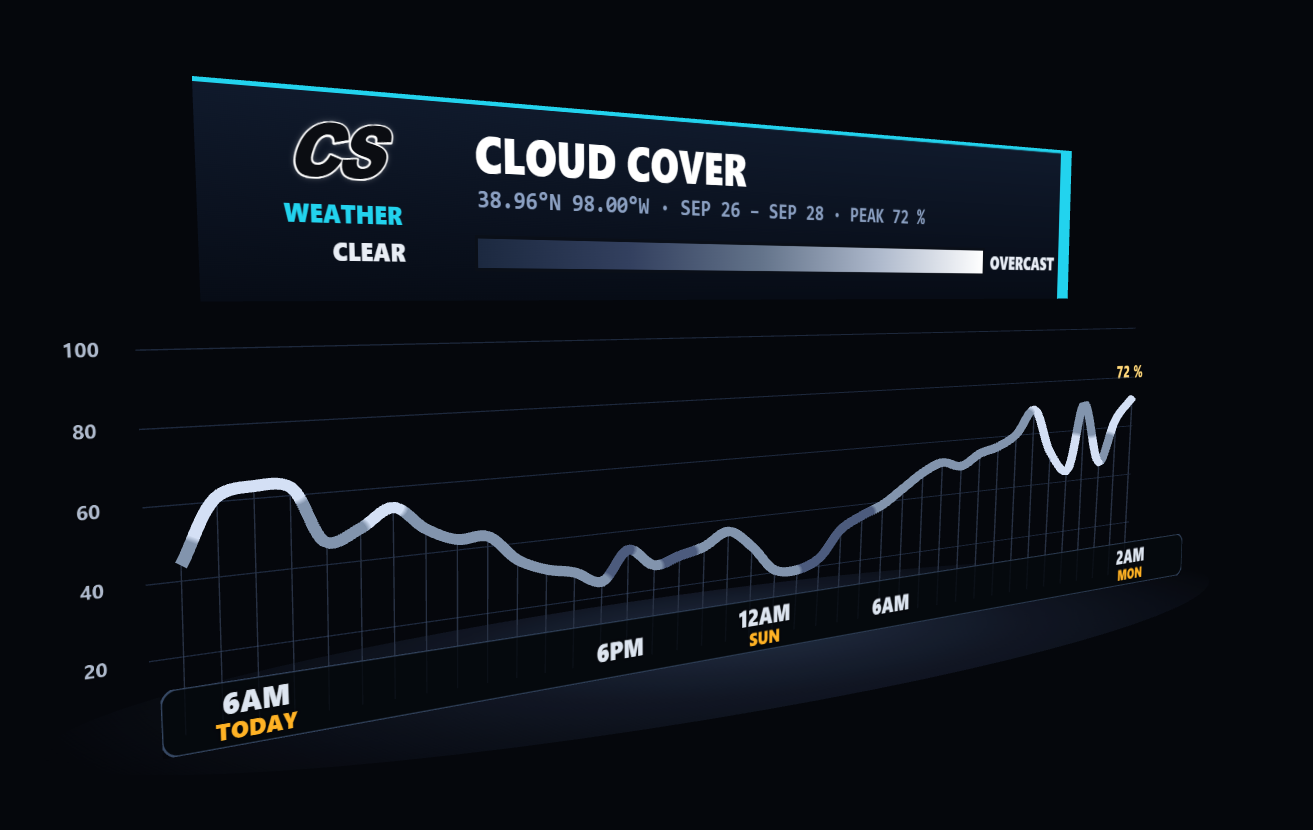
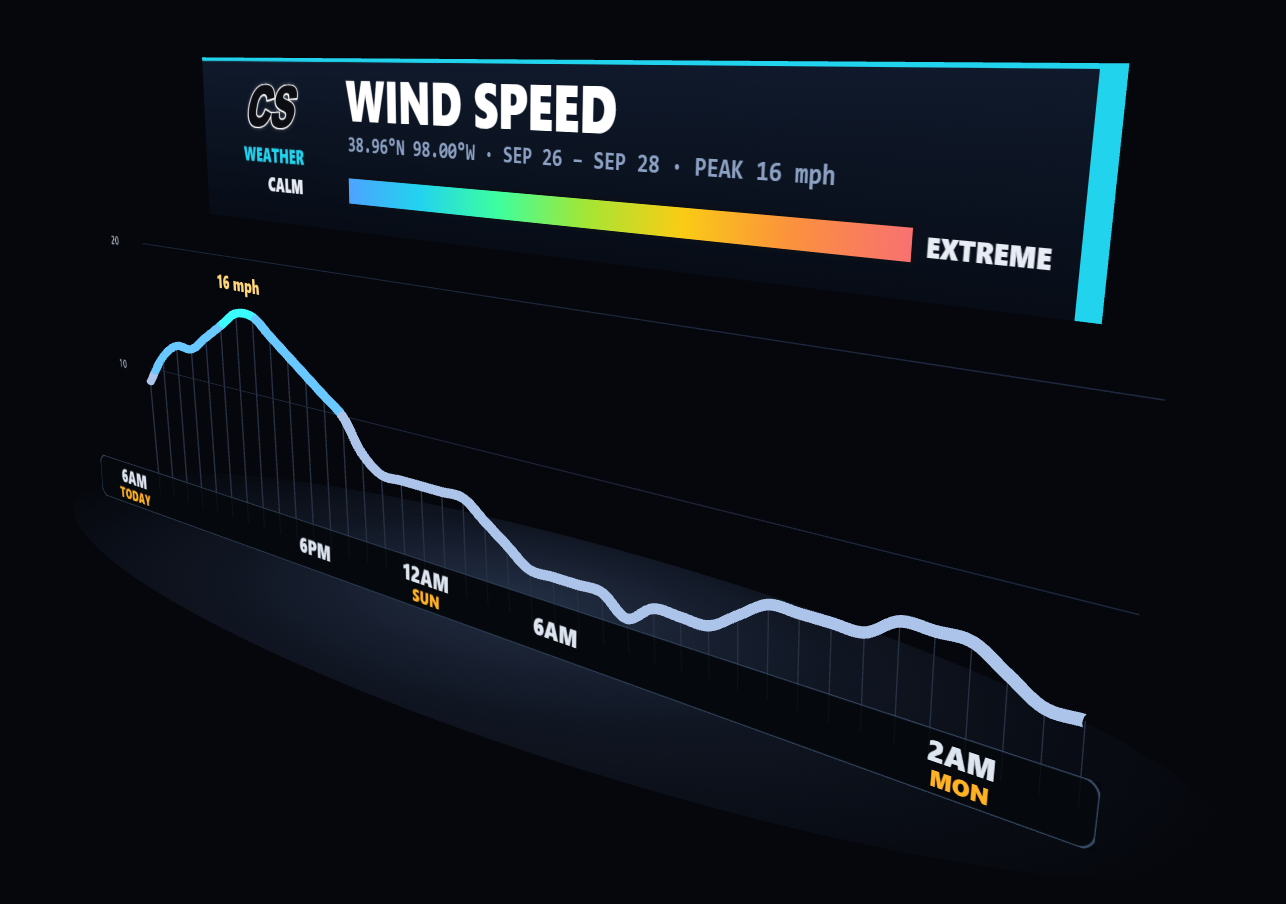
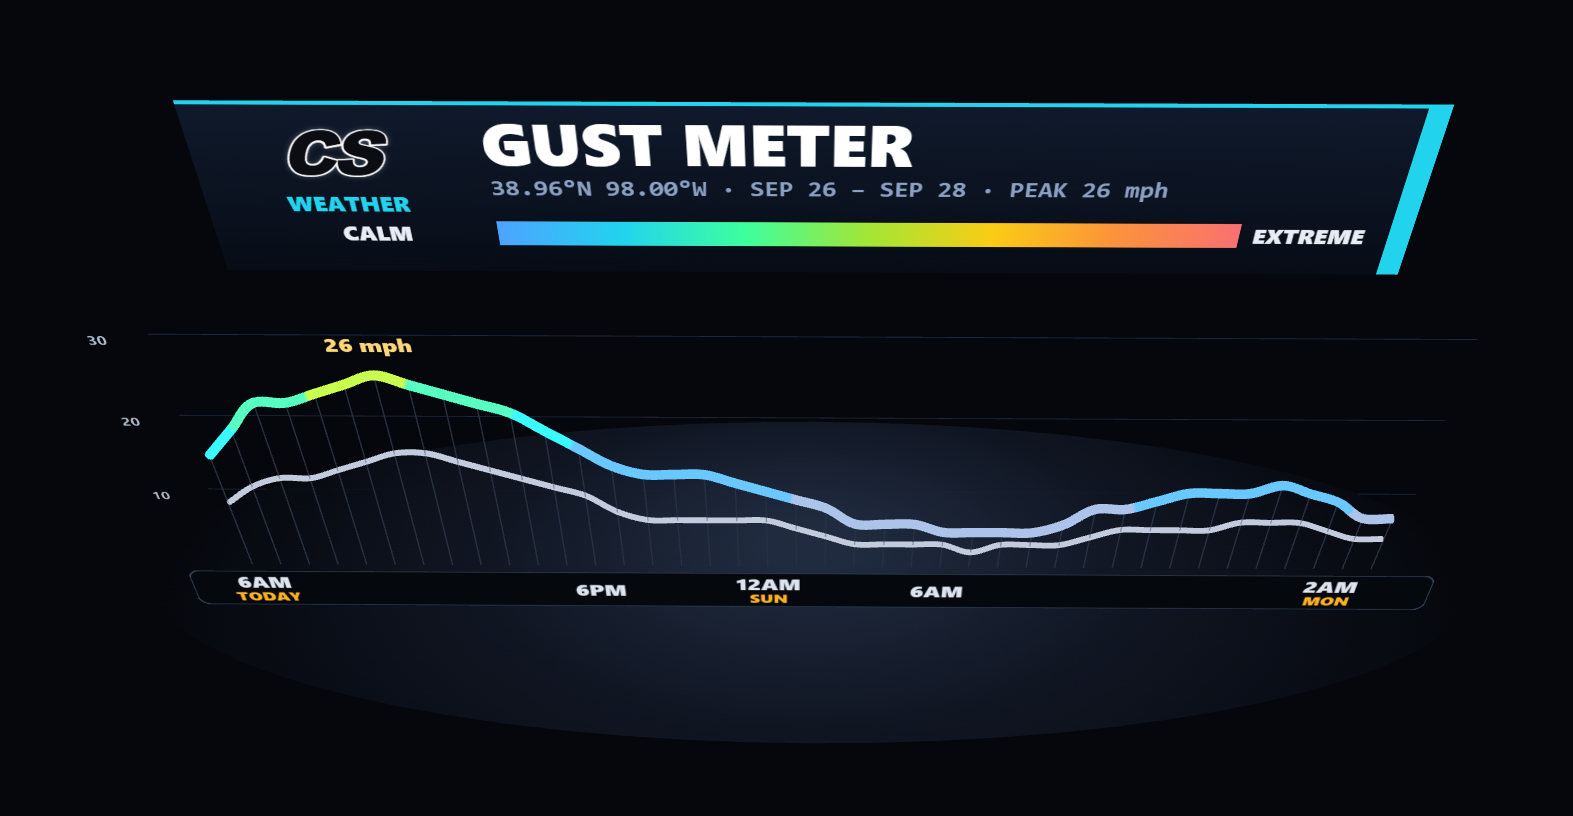
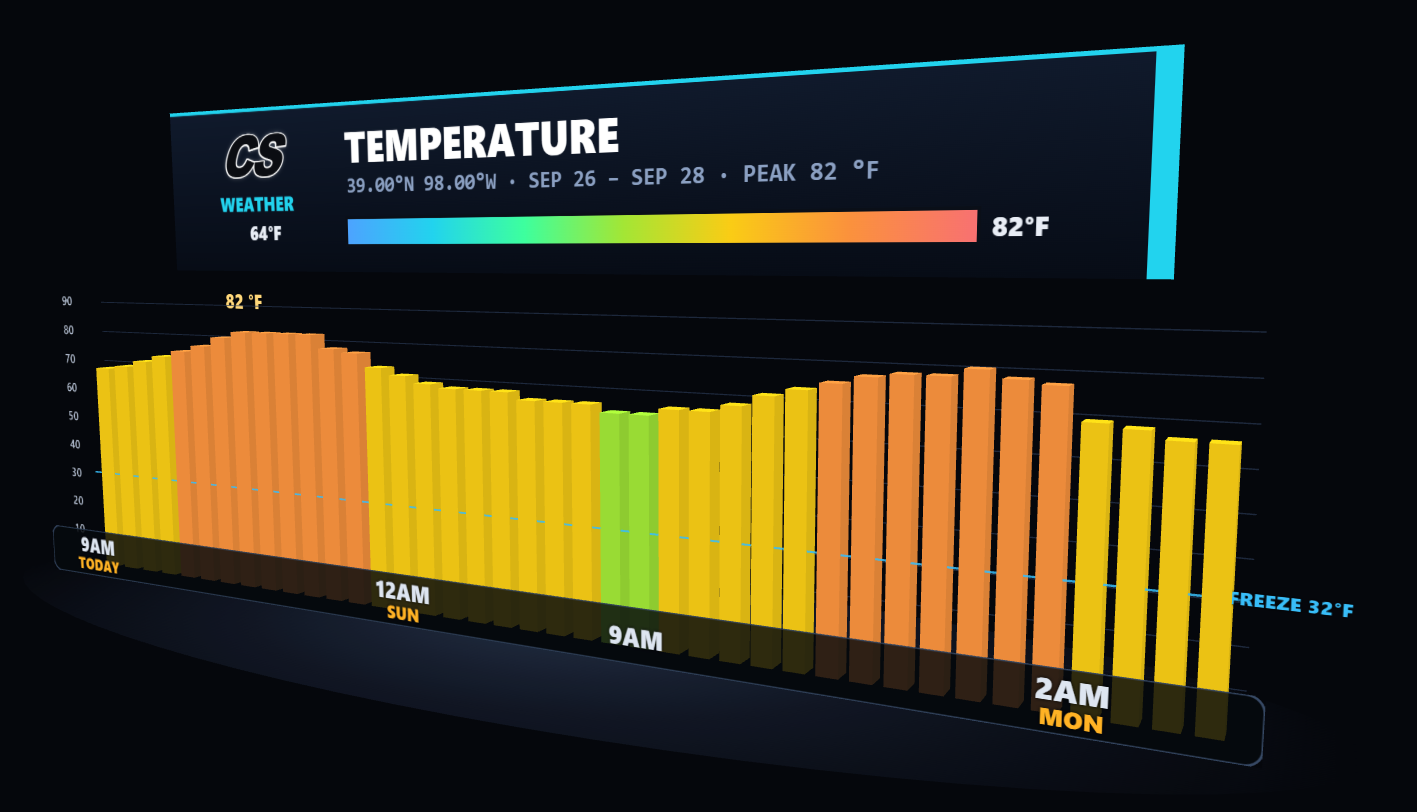
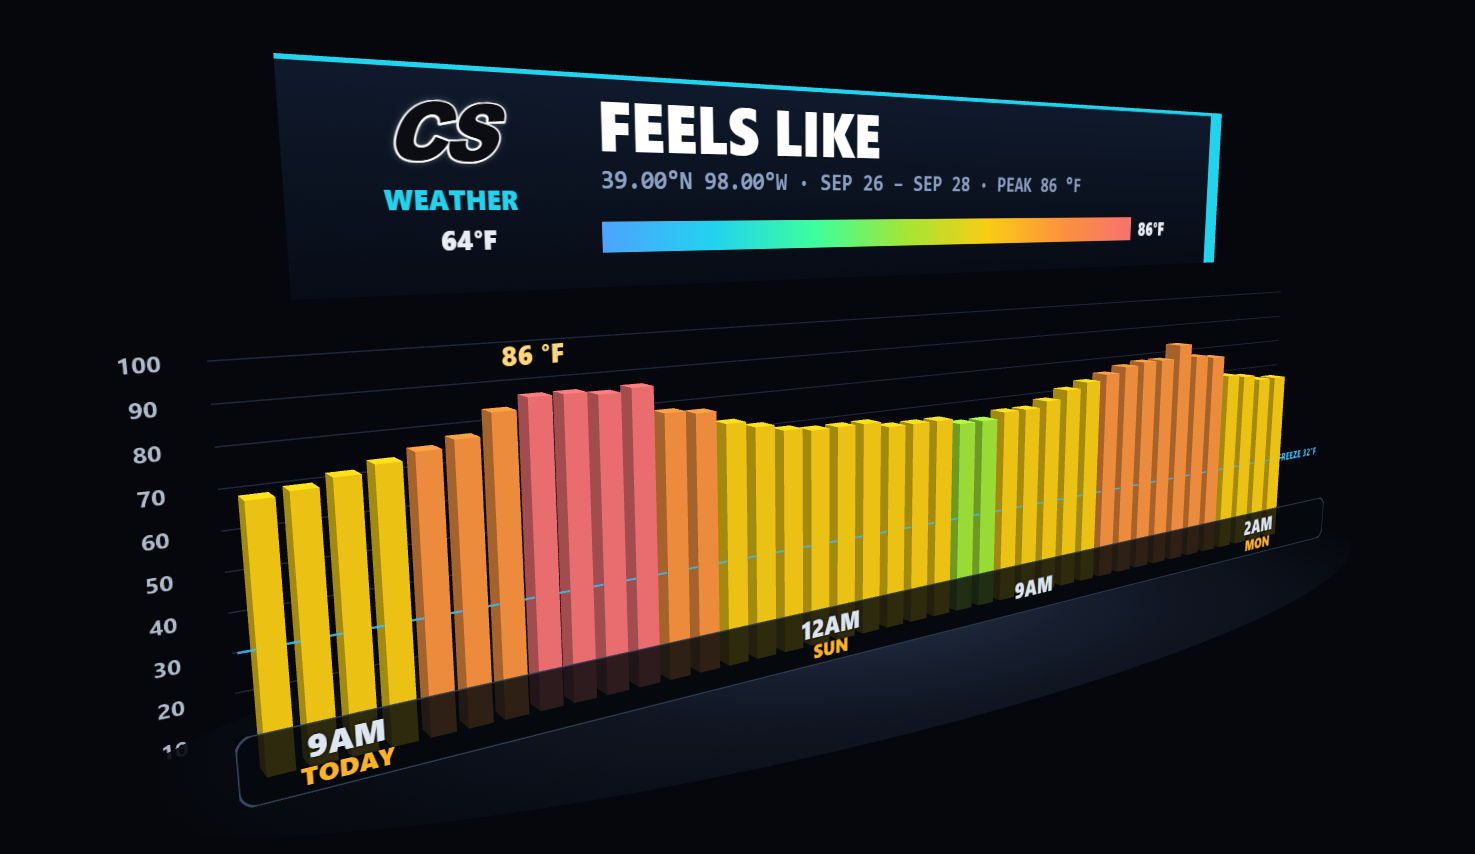
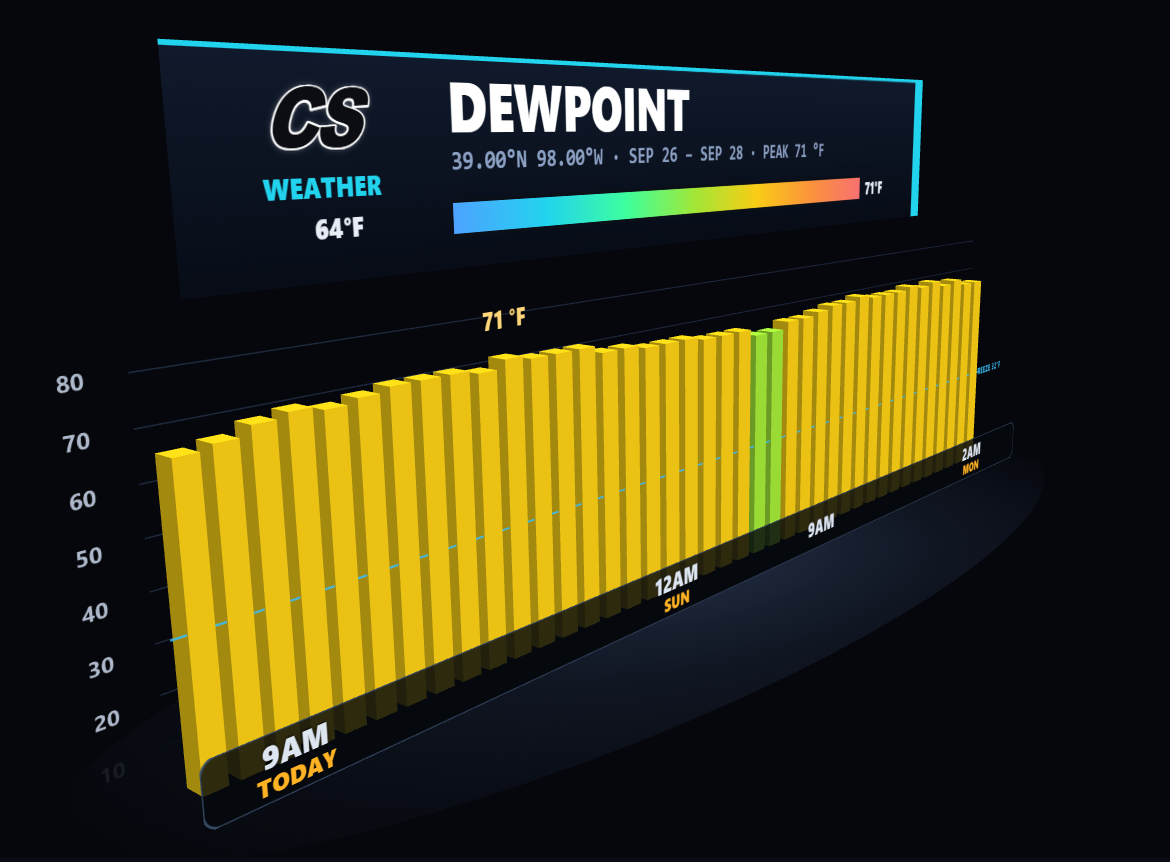
3D WEATHER GRAPHS38.96°N 98.00°W, SEP 26 TO SEP 28, 6AM TO 2AM
Timeline graphs with the CS banner, peak callouts, and a perspective grid. You set the location, dates, units, colors, and logos. These generate automatically in CellScope Studio, so nothing needs hand editing.
Cloud cover: clear to overcast, peak 72%
Wind speed: calm to extreme, peak 16 mph
Gust meter: gust against sustained, peak 26 mph
Temperature, feels-like, dewpoint bar graphs
In development
CS1.0 Weather AI Model
CS1.0IN-HOUSE FORECAST MODEL
CellScope's own weather AI model. It is what sits behind the visualizations, so the renders and the guidance come from the same source. Public specs come when they are stable enough to stand behind.
Resolution, regions, and variables: to be announced
MODEL VISUALIZATION SUITEHRRR, NAM, GFS, ECMWF, ICON, MORE
A models-only desk. Every field drawn on a clean basemap with roads and city labels, nothing else competing for attention. Step through forecast hours and read the valid time as you go. Ships as its own build, separate from the radar app.
Global and regional models in one picker
Temperature, precipitation, severe, and wind field groups
Timeline slider with valid-time readout
In development
Demo available
CellScope Radar App
CELLSCOPE RADARRADAR APPLICATION, WINDOWS FIRST
Standalone radar application for live storm tracking. First release on Windows, built as a desktop window rather than a browser tab.